PLIM PROJECT - GROUP GR17
You will find below the link for the source code of our application in GitHub : Application Code source
MAIN INFORMATIONS about the Project
MEMBERS
In the following, [OUHICHI Haykel] [Gharsalli Dalel] is the list of names of members of our group.
Title of the Project : SPEED CLUSTERING
![]()
Name of the members of the Group
| First Member | Second Member | |
|---|---|---|
| First Name | Haykel | Dalel |
| Last Name | OUHICHI | GHARSALLI |
| haykel.ouhichi@esprit.tn | dalel.gharsalli@esprit.tn | |
| Cursus | IAM | IAM |
Equipments
| Model of Phone | HTC - Windows phone 8S |
|---|---|
| Personal Phone | N |
| IMEI of the phone | 353760058896343 |
Content of the Project
I- Project Description :
Born from the idea of creating an application which makes a classification of persons per profile whether on foot, by bike or by car. Speed application provides users with their current location,speed and other informations and allows them a grouping of their visited places.
II- Technologies and Tools :
In this part we will define some technologies and tools used in our project such us GPS sensor,K-means algorithm and local data base.
1- GPS (GLOBAL POSITIONING SYSTEM) :
- What is a GPS Sensor ?
In our application and in order to response to all our needs we used the GPS Sensor. The GPS is a system of radio navigation by satellite developed and exploited by the Ministry of Defence in the United States. The GPS signals are accessible by an unlimited number of users simultaneously and it's given free of charge to all the users. Due to GPS sensor, you can get current information about users such as :
• Latitude
• Longitude
• Altitude
• Status
• Speed
• Bearing
We can say also that GPS Sensor have some options like displaying it automatciclly when it's closed by selecting “Show GPS Sensor” when GPS pane is closed check box or to close it and showing the GPS pane.
- How does it works ?
Every GPS satellite transmits signals in equipments on the ground. The GPS receivers receive passively the signals of satellites, without broadcast.They require a view released of the sky and are thus used only outside. Their performances can be allocated in the woody zones or near big buildings. The functioning of the GPS receivers depends on an extremely precise hourly reference which is supplied to them by the clocks of the U.S. Naval Observatory. Every GPS satellite contains atomic clocks.
The system of GPS global positioning ( Global Positioning System) uses a network of satellites which allows the users having a GPS receiver to determine their position to any place in the world.
2- K-means clustering :
- The objective of the method :
The algorithm of the k-averages (or K-means ) is an algorithm of partitionnement of data raising statistics and machine learning. this method divide observations K cluster in which every observation belongs to the partition with the closest average. The dynamic thick clouds are a generalization of this base, where every partition is represented by a core which can be more complex than an average. We add also that the classic algorithm of K-means have the same functionality as the algorithm of quantification of Lloyd-Max.
- Algorithm method :
In the method of “k-means”, the choice of the initial centers is made on the basis of a random edition without put back of k individuals from the population to be classified.
Entry: k the fixed number of groups
START: Choose randomly the centers of the groups
REPEAT
i. Allocate every case to the closest group to its center
ii. Recalculate the center of every group
UNTIL (stabilization of the centers)
OR (number of iterations =t) OR (stabilization of the total slowness of the population) END
- Stop condition of the algorithm :
• When two successive itérations lead to the same partition.
• when we reach the max number of iterations(already fixed).
- The algorithm's limit :
The reading of this algorithm suggests the following remarks
• The method of “k-means” is strongly bound among the k number of classes fixed at the begining. However the classification l classes with l> k can be widely different from the classification k classes.
• The classification using this method depends on the choice of the initial centers.
3- Local data base :
To store and retrieve data in our project we made appeal to a local database. This local DB uses LINQ to SQL to allow an object-oriented approach in order to work with data and comprises an object model and a runtime.
III- Project Step by Step :
1. Data Collection
The GPS Sensor used in our project allows the users to determine their position, their speed and the hour of day in earth, at sea and in the air 24/ 24 hour, in all weathers and to any place in the world. In the launch of the application, there will be a restoration and a recovery of all these data then posting them on the first interface «transportation mode”.
2. Data Storage
Once Data are collected it will be stored in a local data base. The local DB will be useful on one hand to apply various processing like classification and on the other hand to Keep a journalisation of the activities of the users and the possibility of displaying them at the needs.
3. Profiles classification
After collecting Data we apply a classification by speed on users in order to obtain finally 3 profiles whether on foot, by bike or by car. And this classification will be marked on our page with small images which signify each case.
4. Clustering
In our application once profiles are classified we ally K-means algorithm to have a clear distribution in form of group of the places the most visited and seen frequently by the users. These cluster will be shown on the maps and marked with circles.
IV- Application functionalities :
SOFTWARE PACKAGES of the Project
- README File :
- Project zip file :
- All required softwares :
HOW TO USE IT
| How to use ower project | |
|---|---|
| Deployment of the application to the phone | Application Welcome Page |
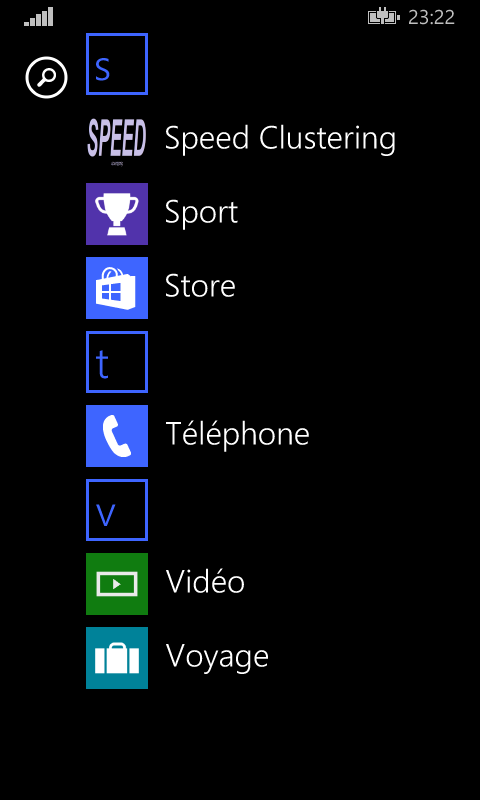
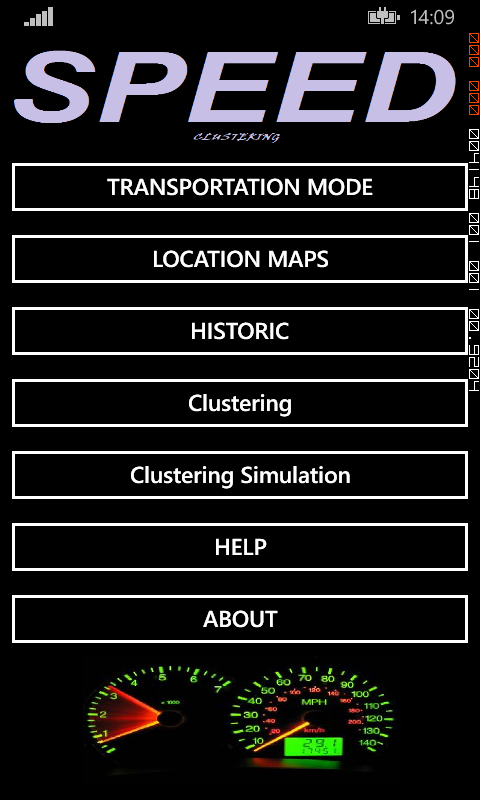
| Our application SPEED as its logo indicates it, contains 8 page each presents a precise feature. | It is the welcome page ,where we find the main menu which allows us to reach 7 interface. |
 |  |
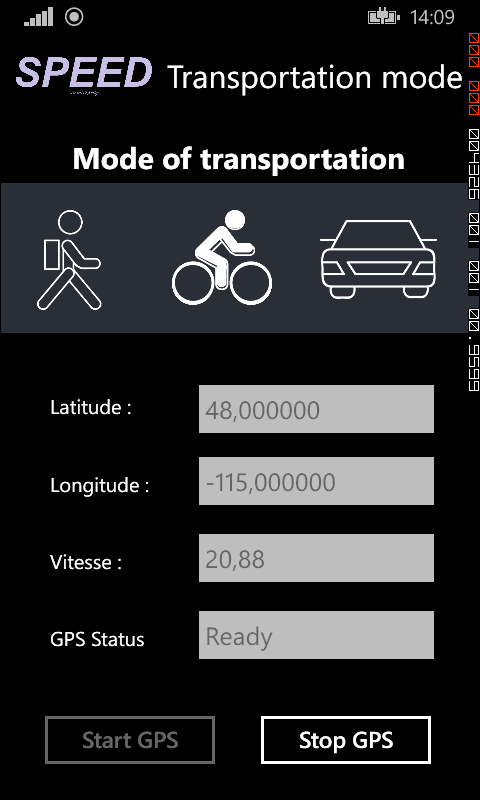
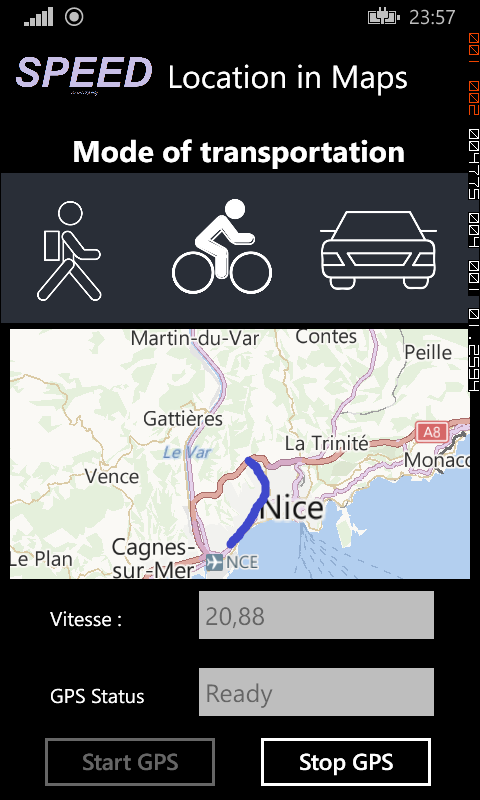
| Transportation Mode Page | Location in Maps Page |
| In this interface we get back the longitude and the latitude as well as the speed of the user which allows us to classify him per profiles whether on foot, by bicycle or by car. | This interface posts the current location of the user according to its coordinates. His displacement will be marked with circles one the maps to visualize his trajectory and touring on Maps in real time. |
 |  |
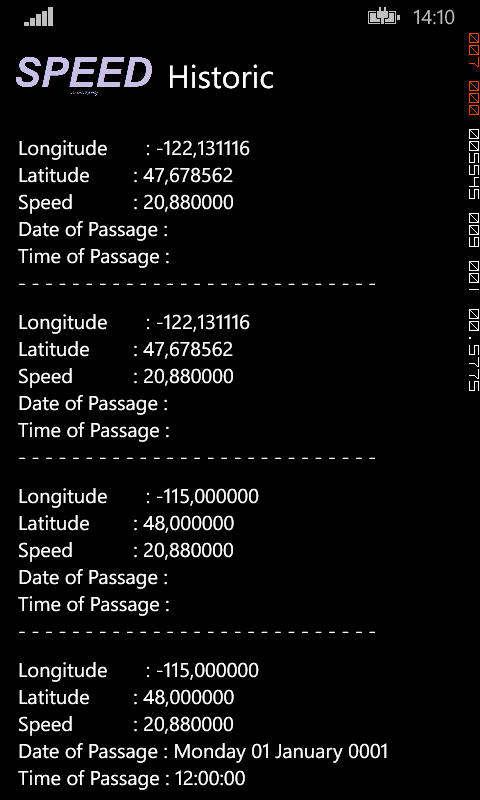
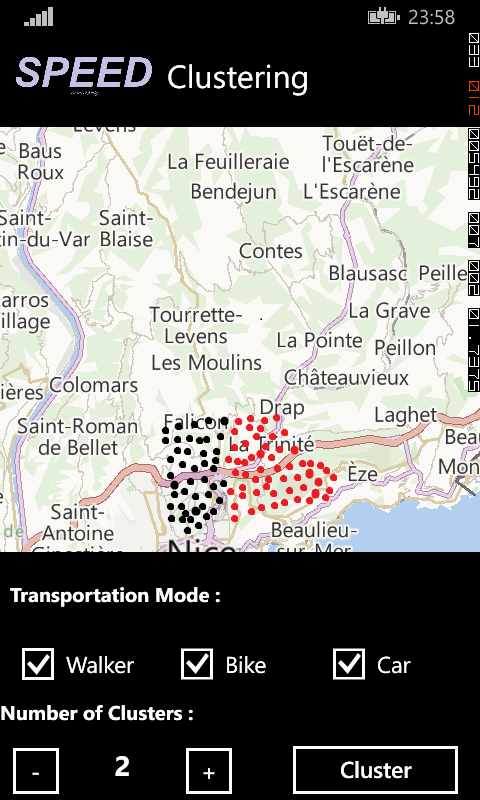
| Historic Page | Clustering Page |
| Keep tracking about user activities in term of time ,position, date and time. All of these informations are stocked in a local DataBase | On this page we apply the algorithm of clustering to the data stored in our base. Every cluster will be posted on the map with a different color and the user will have the possibility of choosing the number of group from the beginning. |
 |  |
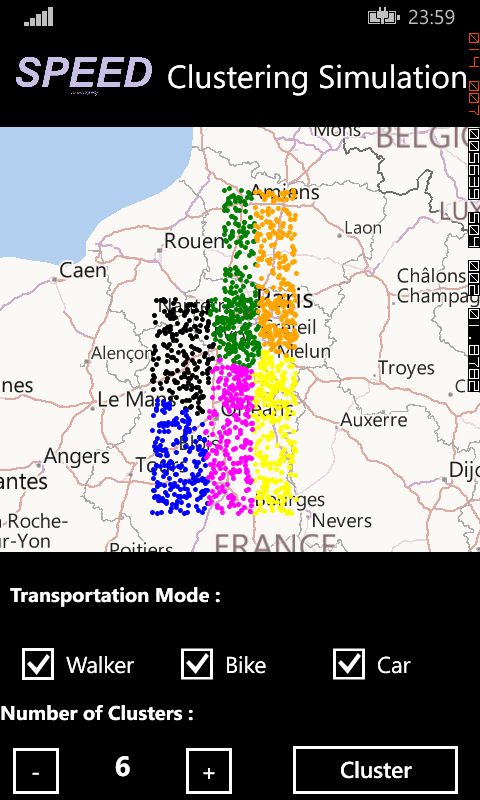
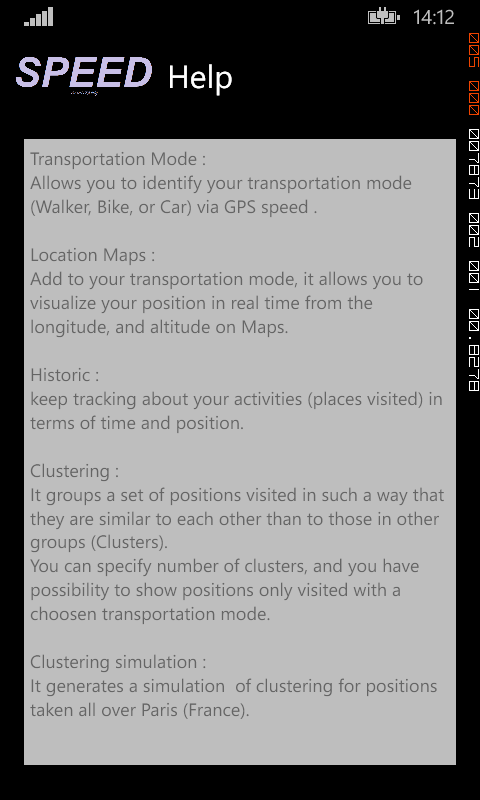
| Clustering Simulation Page | Help Page |
| For the clustering simulation we chose Paris as zone to apply the k-means. It‘s a direct simulation at the level of the RAM, no stored data. | It explains in detail the role of each part in our application. |
 |  |
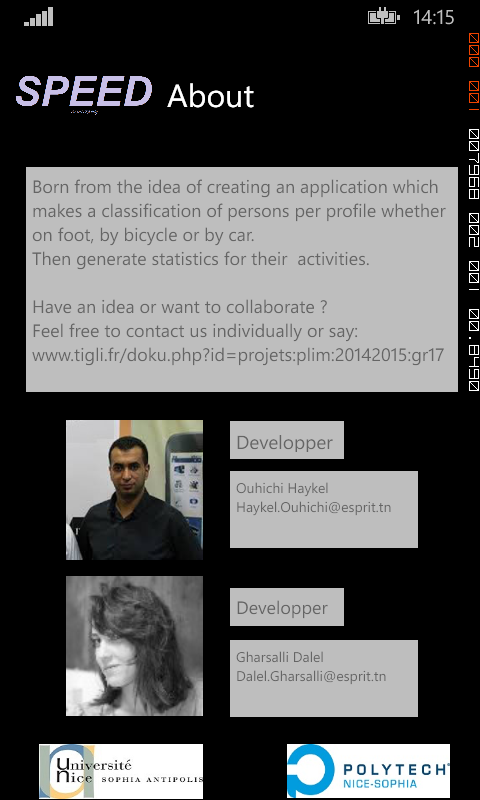
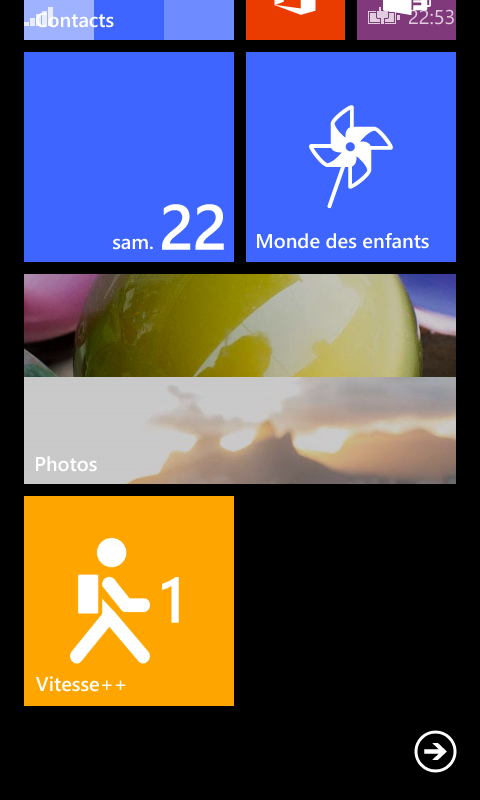
| About Page | Application Tile |
| Gives an overview about the application and every person who participates in its development. | A Tile that represents our app on the Start screen |
 |  |
RESULTS
The final result of our project is to have a clear classification of users according to their profiles as well as a classification by cluster of their busiest and most visited place. Our application emphasizes the importance of the non-supervised classification and presents a direct resolution of the recognition of the modality of the transport problem of our everyday life.